1 前 言
1.Preface
Entrusted by Co., Ltd., beneficiation experiment is conducted on the ore of some gold mine to determine reasonable technological process and technical indexes, thus providing technical basis for developing and utilizing the ore.
The mineral composition of the ore is relatively simple. The metallic minerals in the ore are mainly ferric oxide and copper oxide, and the gangue minerals are mainly quartz. The chemical analysis result of the sample is as follows: with gold grade of 4.45g/t and silver grade of 239.90 g/t, the ore sample contains 0.73% copper, 13.63% iron and 58.69% quartz.
The recyclable elements in the ore are gold and silver. Although the content of copper in the ore reaches 0.73%, the copper mineral will not be recovered because there are mainly difficultly floated copper oxides with low flotation recovery rate.
According to the requirements of the contract, exploratory experiment of recycling gold and silver through gravity separation as well as experiment of all-slime cyanidation and flotation process condition are conducted on the ore. All-slime cyanidation process achieves fairly good experimental indexes. With 90% of the grinding fineness of﹣0.074mm, 14kg/t of calcium oxide, 7kg/t of sodium cyanide and 24h of leaching time, the cyanide leaching rate of gold reaches 93.93% while that of the silver is only 30.29%. To obtain better silver cyanide index, higher sodium cyanide dosage and longer leaching time are required. Under the condition with 12kg/t of sodium cyanide and 66h of leaching time, the cyanide leaching rate of silver reaches 87.63%. In view of such a situation, assessment of recovering silver through flotation is conducted on the cyanide gold leaching tailings in this experiment. The result of the cyanide tailing flotation open-circuit test: after the primary cleaning, silver concentrate grade can reach 12273.18g/t and the recovery rate of silver in concentrate is 67.86%; non-cleaned silver concentration grade is 3047.49 g/t and the recovery rate of silver in concentrate is 74.45%. After four scavengings, the remaining rate of silver in tailings is 9.51%. The test result shows that the cyanide tailings can obtain fairly good silver recovery indexes through flotation.。
2.Sampling & Preparation of Testing Samples
The sampling and representativeness of the testing ore sample are the responsibility of the entrusting party. The ore samples weigh about 50kg and are arranged by the entrusting party to deliver to this Institute in two times through logistics. The first received ore samples are sample 1# (test number, the original sample has no mark) and sample 28# while the second received sample is sample 3# (test number, the original sample has no mark). The three samples are made into products with granularity of -2mm after crushing and sieving, which are sampled respectively for assay and analysis of gold and silver. Then the three samples are mixed as test sample, that is, test primary ore sample. The assay and analysis result of the mixed sample is as follows: gold grade is 4.45g/t while silver grade is 239.9 g/t.
See Fig.1 for the testing sample preparation flow.
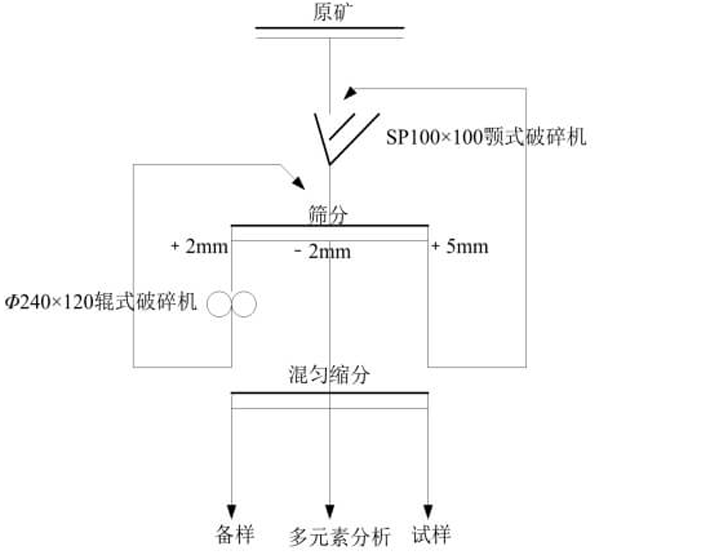 Fig.1. Testing Sample Preparation Process Flow
3. Analysis of Raw Ore
3.1 Multielement analysis of raw ore
See Table 1 for the multielement analysis result of raw ore.
Table 1 Multielement Analysis Result of Raw Ore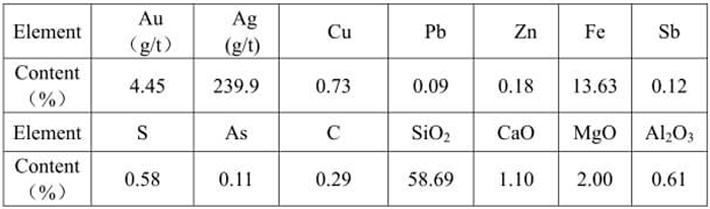
3.2 Sieve Analysis of Raw Ore
See Table 2 for the sieve analysis result of raw ore with grinding fineness of -0.074mm accounting for 90%.
Table 2 Sieve Analysis Result of Raw Ore Granularity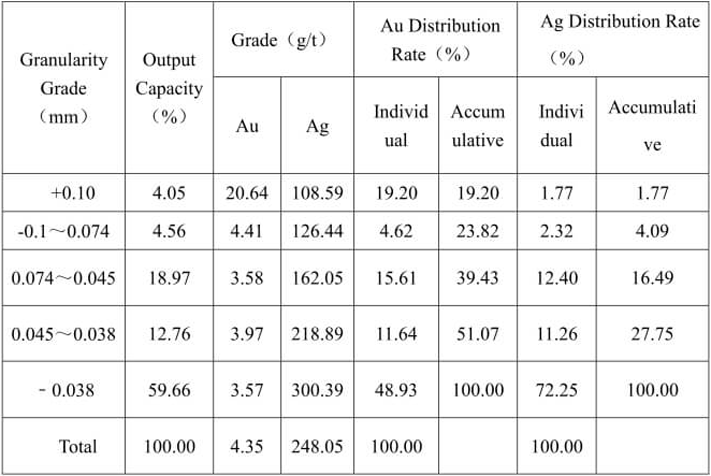
3.3 Calibration of ore grinding granularity
XMQ240×90 Conical Ball Mill is used to take the ore grinding granularity calibration on the primary ore sample of ﹣2mm in the laboratory. See Fig.2 for the ore grinding granularity curve.
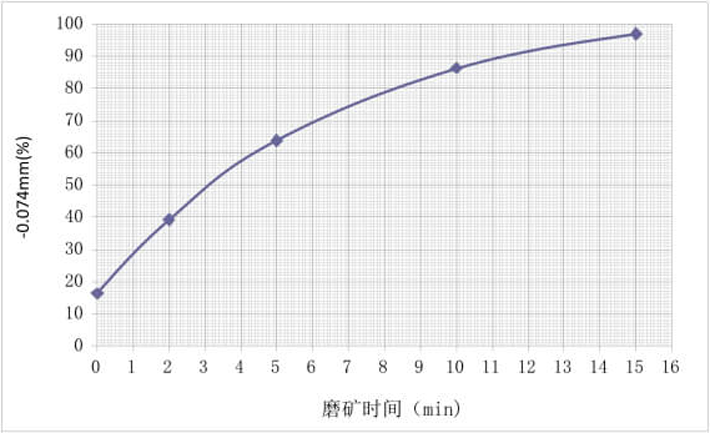 Fig.2 Ore Grinding Granularity Curve
3.4 Measurement of ore specific gravity
The specific gravity of the ore is measured as 2.73 with pycnometer in the laboratory.
4. Gravity Separation Exploratory Test
See Fig.3 for the process of gravity separation exploratory test and Table 3 for the test result.
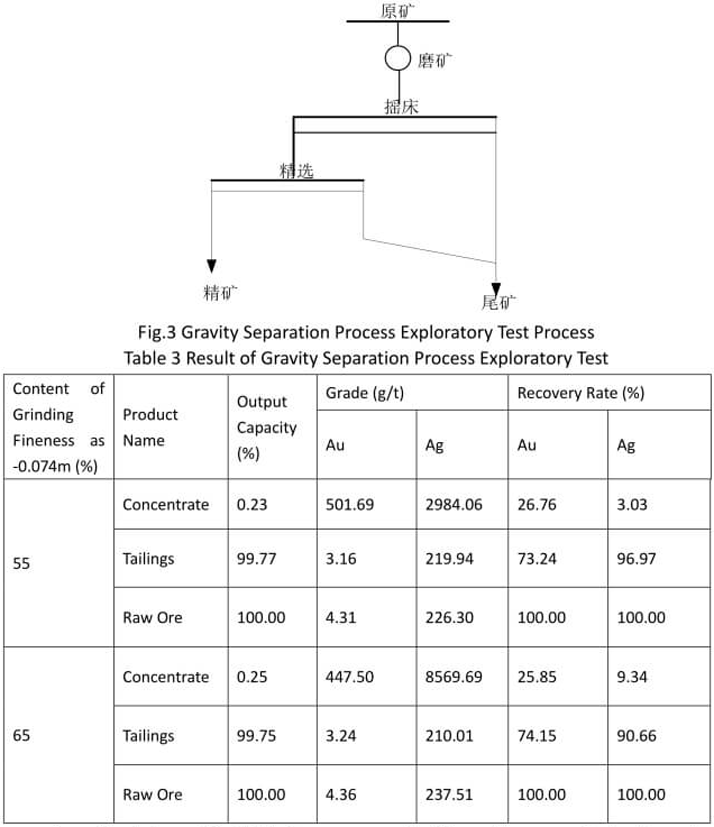
From the test result in Table 3, we can see that the gold recovery index through gravity separation is good while the silver recovery rate is low. The silver mineral is not suitable for gravity separation recovery because of its fine embedded granularity.
5. Flotation Process Test
5.1 Flotation grinding fineness test
See Fig.4 for the test flow and Table 4 for the test result.
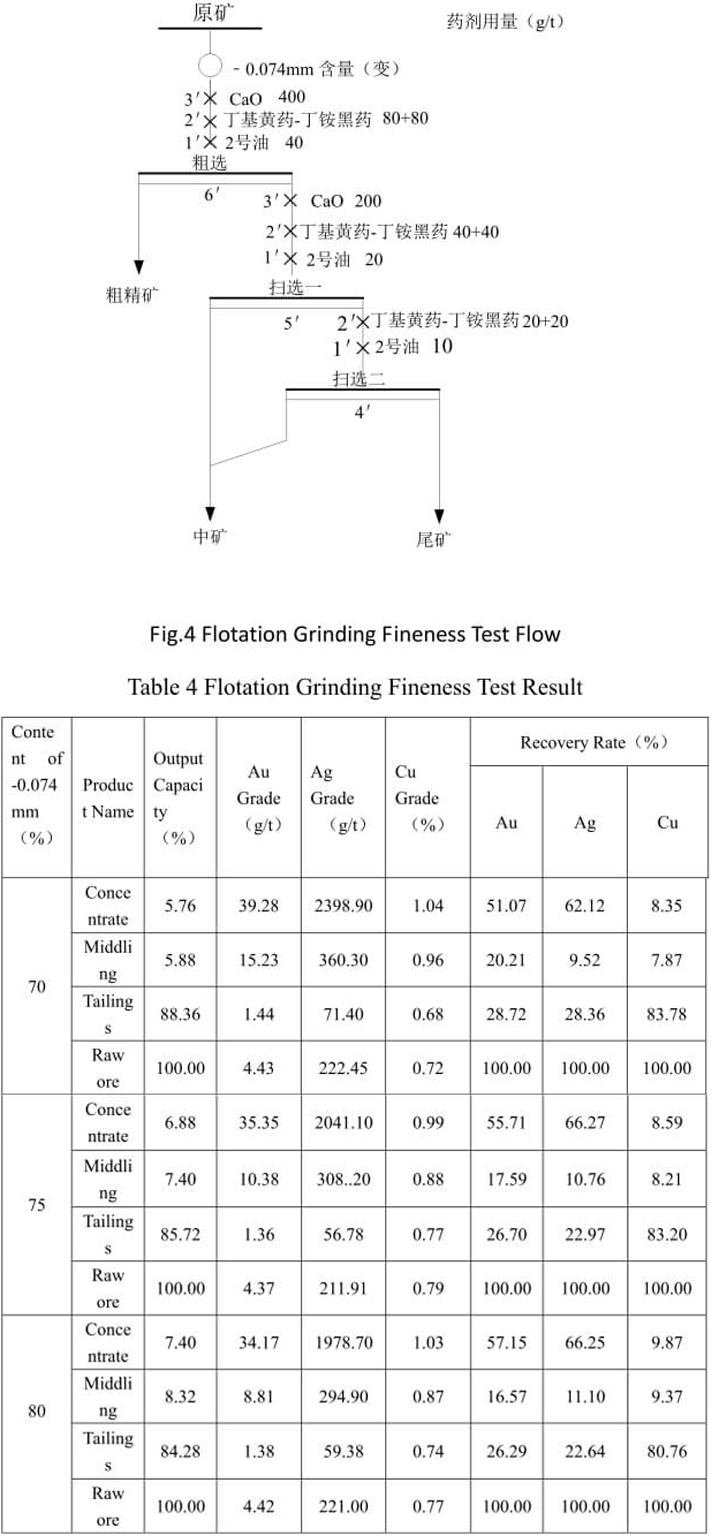
The test result in Table 4 shows that when the grinding fineness of -0.074mm accounts for 75%, the flotation recovery indexes of gold and silver are good; the recovery indexes of gold and silver are not improved with the increase of grinding fineness; after flotation, copper is basically not beneficiated. This indicates that copper mineral comprises mainly of difficultly floated copper oxide.
5.2 Vulcanizing agent test
According to the properties of the ore, assessment of sodium sulphide and ammonium sulfate is conducted in improving the flotation effect of gold, silver and copper. See Fig.5 for the test flow and Table 5 for the test result.
5.2.1 Vulcanizing agent selection test
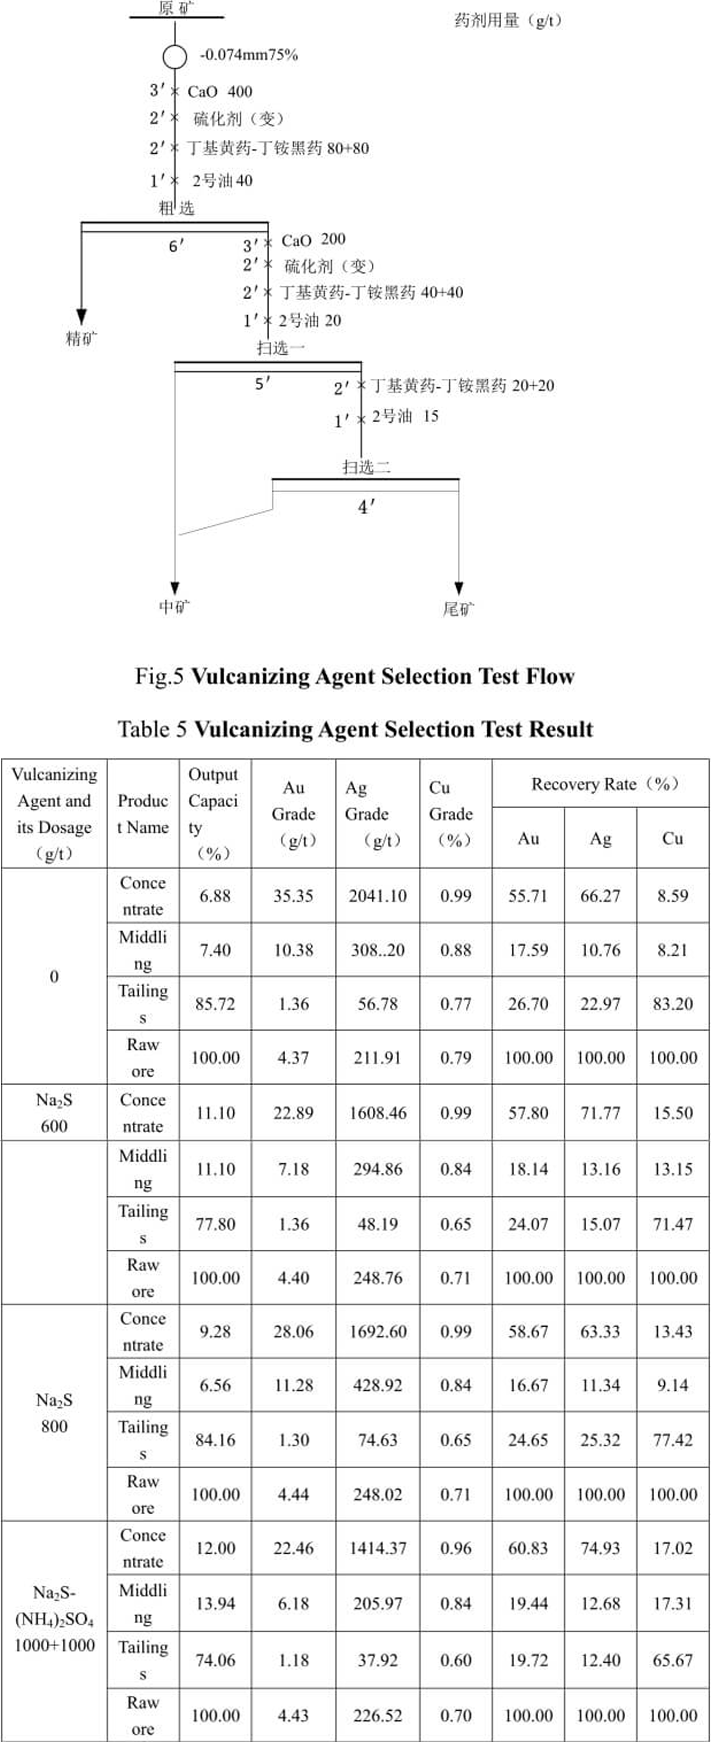
From Table 5, we can see that the gold and silver recovery indexes with the addition of vulcanizing agent are higher than that without the addition of vulcanizing agent. The gold and silver recovery effect with mixed use of Na2S- (NH4)2SO4 is better than that with only use of Na2S. Compared with no addition of vulcanizing agent, the copper flotation recovery index after vulcanization is slightly improved, but the copper grade and recovery rate are still low and the copper is not beneficiated in concentrate. This indicates that the copper oxide mineral in this ore can not be recovered by conventional and simple flotation process.
5.2.2 Na2S- (NH4)2SO4 Dosage Test
See Fig.5 for the test flow and Table 6 for the test result.
Table 6 Na2S- (NH4)2SO4 Dosage Test Result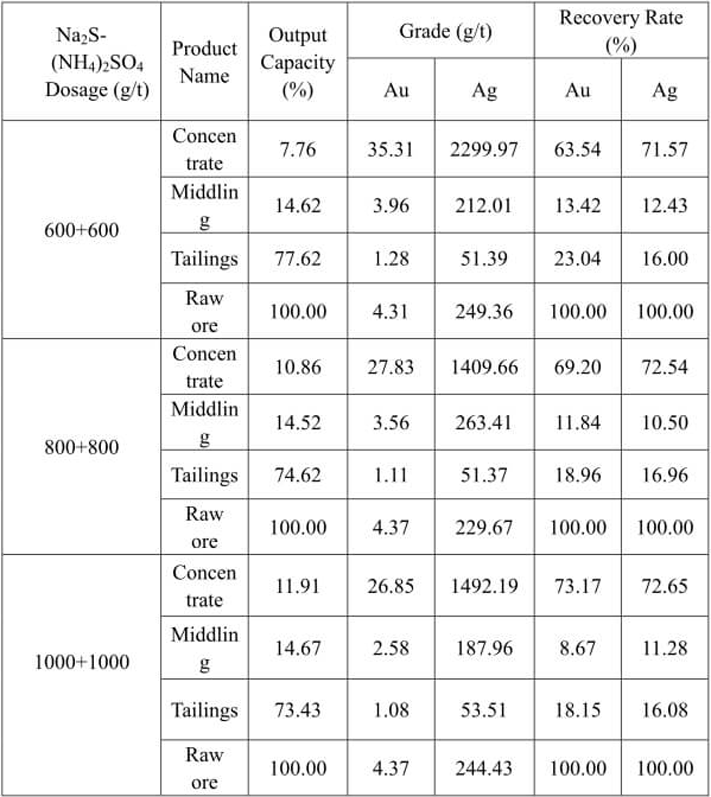
The test result in Table 6 indicates that the leaching rates of gold and silver in tailings are 18.96% and 16.96% respectively when the dosage of Na2S- (NH4)2SO4 is 800+800g/t; the index has no obvious improvement with the increase in dosage. The dosage of Na2S- (NH4)2SO4 is determined to be 800+800g/t through test.
5.3 Collecting agent dosage test
See Fig.6 for the collecting agent dosage test flow and Table 7 for the test result.
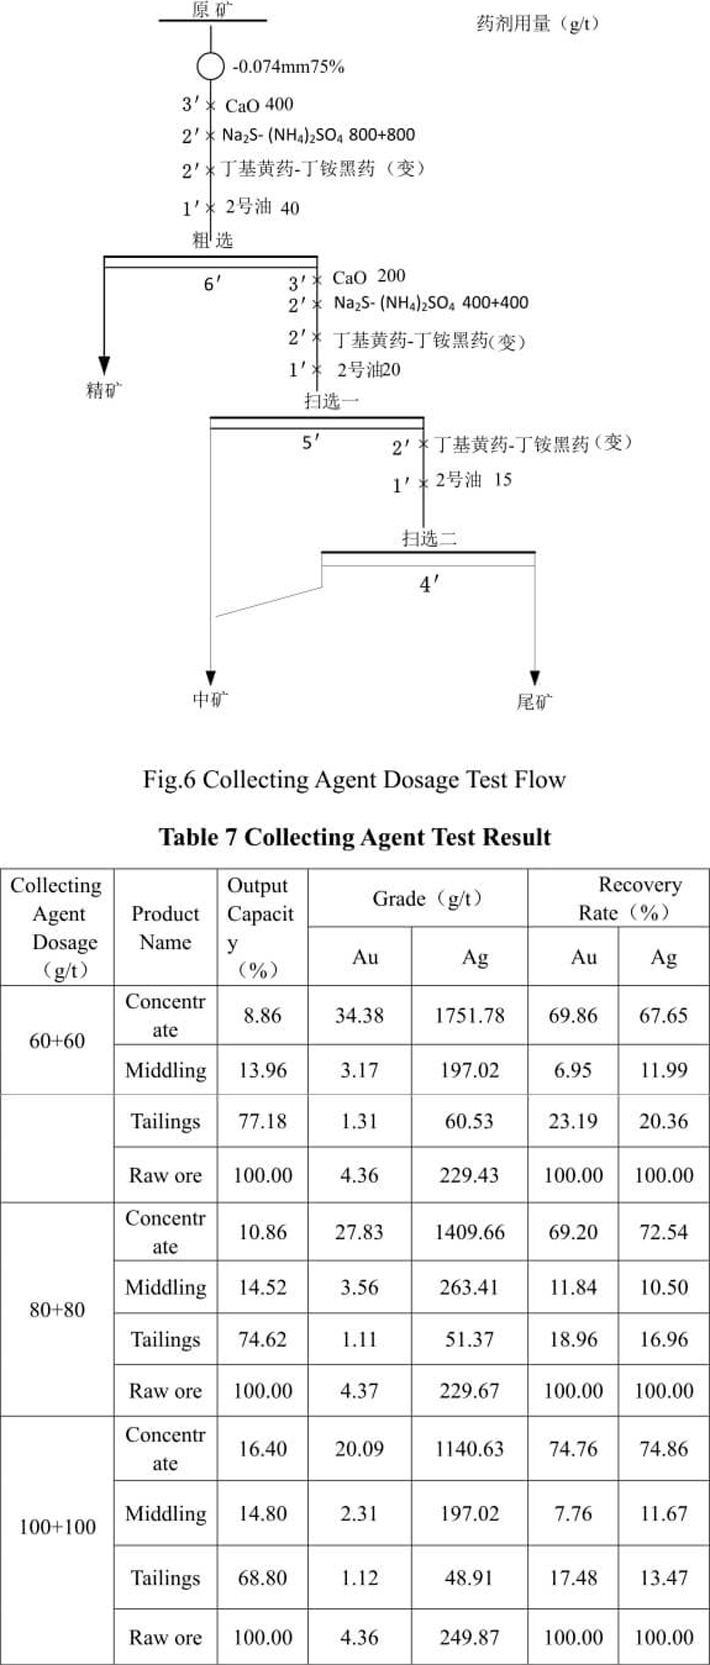
From the test result in Table 7, we can see that the suitable dosage of collecting agent butyl xanthate-clino-pyrrhotite is 80+80g/t. Because it is oxidized ore, the dosage of collecting agent is large, the floating quantity of slime is large and the concentrate grade is low. In the flotation circuit, the slime will affect the separation effect.
5.4 Comprehensive condition test
Comprehensive condition test is carried out on the basis of major condition test. Inhibitors are added in the comprehensive condition test to eliminate the effect of the slime. See Fig.7 for comprehensive condition test flow and Table 8 for the test result.
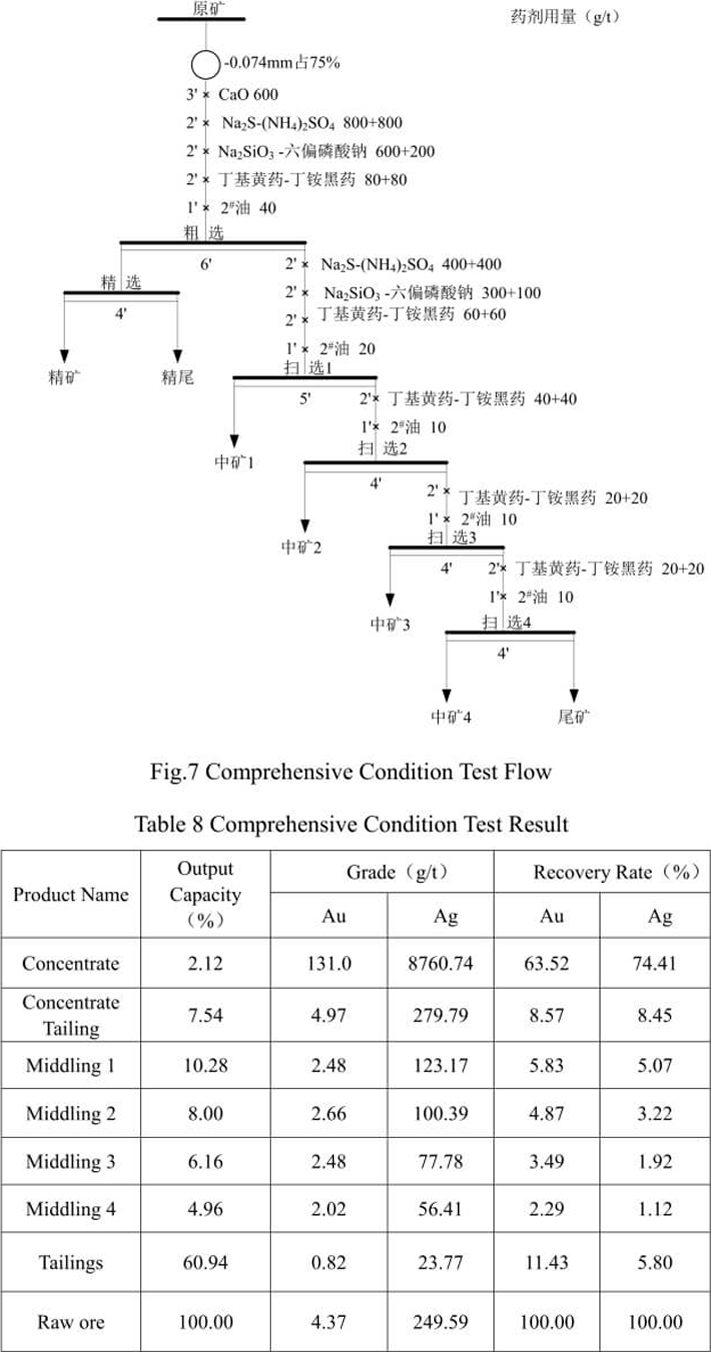
The result of comprehensive condition test indicates that after the primary cleaning, in concentrate, the gold grade is 131.0g/t and the silver grade is 8760.74 g/t, the gold recovery rate is 63.52% and the silver recovery rate is 74.41%. After four scavengings, the remaining rates of gold and silver in tailings are 11.43% and 5.80% respectively. The flotation recovery index of silver is better than that of gold.
5.5 Flotation Summary
The result of flotation test shows that it is not suitable to use the conventional and single flotation process to recover the copper oxide mineral in this ore.
Because of the high degree of oxidation of the ore, the flotation indexes of gold and silver are not that ideal. The result of the flotation open-circuit test is as follows: after the primary cleaning, in concentrate, the gold grade is 131.0g/t and the silver grade is 8760.74 g/t, the gold recovery rate is 63.52% and the silver recovery rate is 74.41%. After four scavengings, the remaining rates of gold and silver in tailings are 11.43% and 5.80% respectively. The flotation recovery index of silver is better than that of gold.
6. Cyanidation Test
6.1 Grinding fineness test
Test condition: the sodium cyanide dosage is 5kg/t, the calcium oxide dosage is 14kg/t, the alkali pretreatment test time is 3h, the cyanide leaching time is 24h and the pulp density is 33%.
See Fig.8 for all-slime cyanidation test flow and Table 9 for the test result.
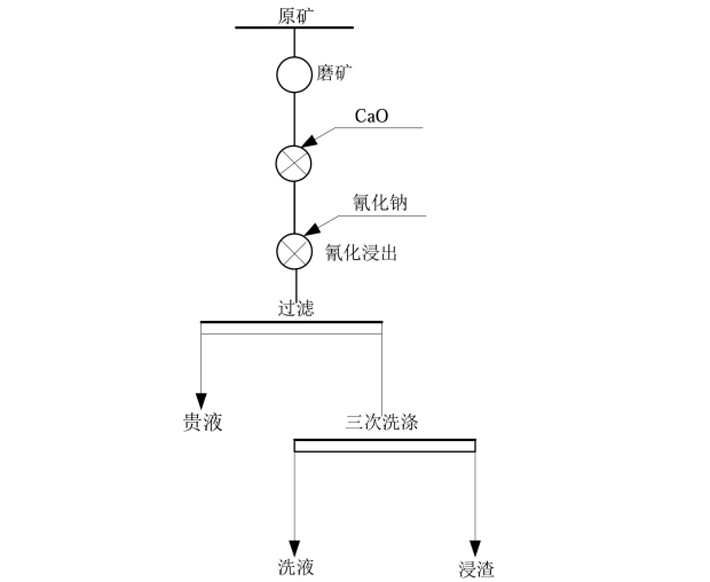 Fig.8 All-slime Cyanidation Test Flow
Table 9 All-slim Cyanidation Grinding Fineness Test Result
Fig.8 All-slime Cyanidation Test Flow
Table 9 All-slim Cyanidation Grinding Fineness Test Result
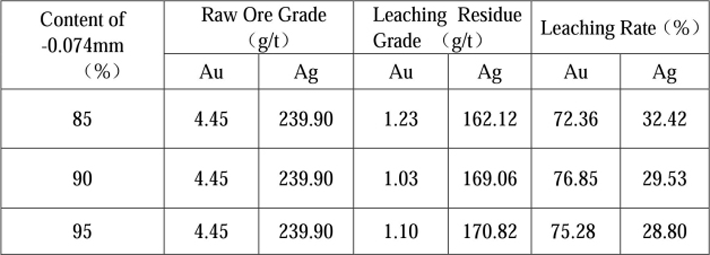
The test result in Table 9 shows that when the grinding fineness of -0.074mm accounts for 90%, the cyanide reaching rates of gold and silver are 76.85% and 29.53% respectively; when the grinding fineness of -0.074mm is increased to 95%, the cyanide leaching rates of gold and silver are not improved. The content of grinding fineness of -0.074mm is determined to be 90% through the test.
Because the pulp of this ore possesses weak acidity, the calcium oxide dosage is relatively high.
6.2 Sodium cyanide dosage and leaching time test
Test condition: the grinding fineness of -0.074mm accounts for 90%, the calcium oxide dosage is 14kg/t, the alkali pretreatment test time is 3h, the pulp density is 33%.
See Fig.8 for the test flow and Table 10 for the test result.
Table 10 Sodium Cyanide Dosage and Leaching Time Test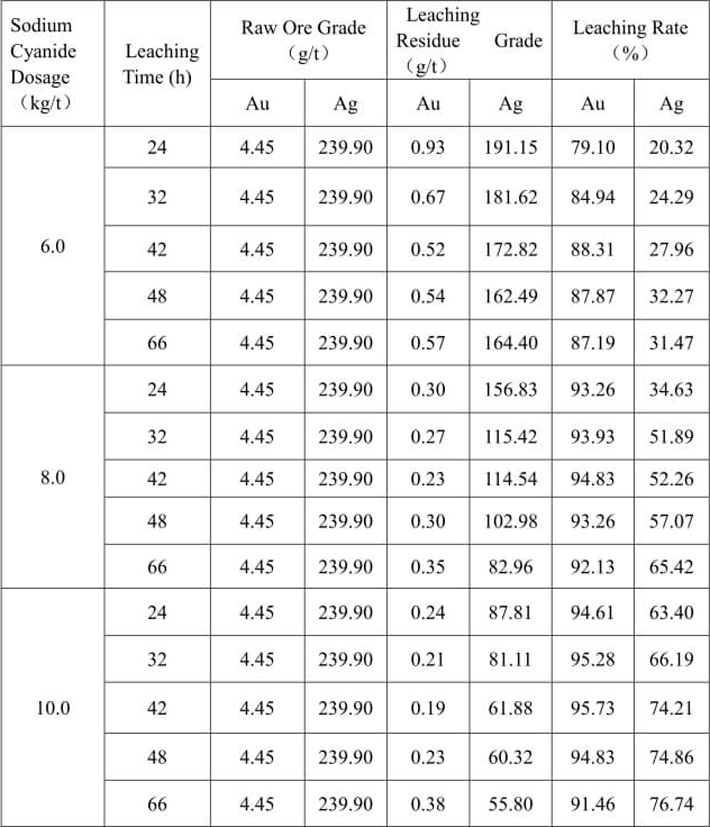
From the test result in Table 10, we can see that when the sodium cyanide dosage is 8kg/t and the leaching time is 24h, the cyanide leaching rate of gold can reach 93.26% while that of silver is only 34.63%. When the sodium cyanide dosage is 10 kg/t and the leaching time is 66h, the silver grade in cyanide residue is 55.80g/t and the leaching rate reaches 76.74%. This indicates that the silver mineral in this ore is refractory, higher cyanide concentration and longer leaching time are required to obtain better silver leaching index.
6.3 Cyanide pre-leaching pretreatment test
To decrease the cyanide dosage, increase the cyanide leaching speed of gold and silver as well as reduce the cyanide leaching time, tests with addition of sodium hydroxide, leaching agent and extension of alkali pretreatment time are carried out to assess the effects on the cyanide indexes of gold and silver. The test result indicates that when the calcium oxide dosage is 14kg/t, the extension of pretreatment time can increase the cyanide leaching speeds of gold and silver as well as improve the cyanide leaching indexes of gold and silver.
Test condition: the grinding fineness of -0.074mm accounts for 90%, the sodium cyanide dosage is 6kg/t, the calcium oxide dosage is 14kg/t and the pulp density is 33%. See Fig.8 for the test flow and Table 11 for the test result.
Table 11 Pretreatment Time Test Result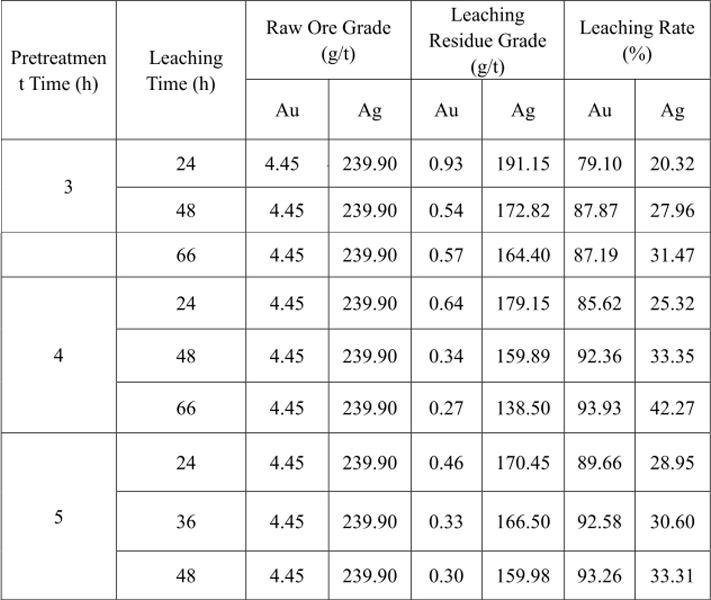
The result in Table 11 shows that when the cyanide pre-leaching pretreatment time is extended to 4h from 3h and other leaching conditions remain the same, the cyanide leaching rate of gold is improved greatly while that of silver is improved slightly. When the pretreatment time is 3h and the cyanide leaching time is 24h and 48h, the gold leaching rates are 79.10% and 87.87% respectively while the silver leaching rates are 20.32% and 27.96% respectively. When the pretreatment time is 4h and the cyanide leaching time is 24h and 48h, the gold leaching rates are 85.62% and 92.36% respectively while the silver leaching rates are 25.32% and 33.35% respectively. With the extension of the pretreatment time, the cyanide indexes of gold and silver have no obvious improvement. The cyanide pretreatment time is determined to be 4h through the test.
6.4 Post-pretreatment sodium cyanide dosage test
Test condition: the grinding fineness of -0.074mm accounts for 90%, the pretreatment time is 4h, the calcium oxide dosage is 14kg/t and the pulp density is 33%. See Fig.8 for the test flow and Table 12 for the test result.
Table 12 Post-pretreatment Sodium Cyanide Dosage Test Result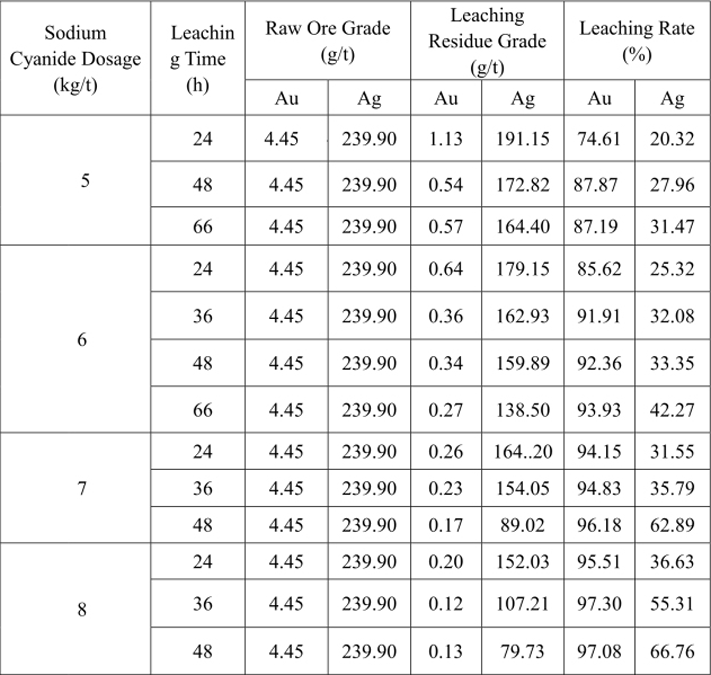
From Table 12, we can see that when the cyanide pre-leaching pretreatment time is 4h, the sodium cyanide dosage is 7kg/t and the leaching time is 24h, the cyanide leaching rate of gold can reach 94.15% while that of silver is only 31.55%. When the sodium cyanide dosage is 8kg/t and the leaching time is 48h, the leaching rate of silver can reach 66.76%.
6.5 Strengthening silver leaching test
Test condition: the grinding fineness of -0.074mm accounts for 90%, the pretreatment time is 4h, the calcium oxide dosage is 14kg/t, the sodium cyanide dosage is 12kg/t, the cyanide leaching time is 66h and the pulp density is 33%. See Fig.8 for the test flow and Table 13 for the test result.
Table 13 Strengthening Silver Leaching Test Result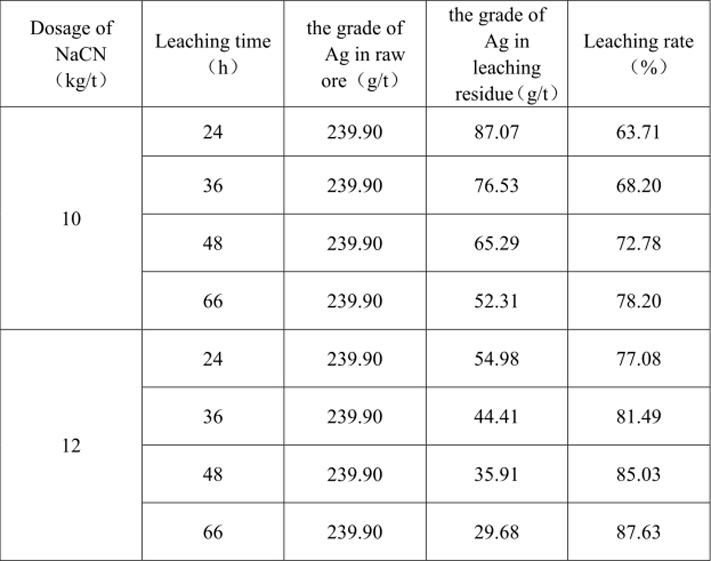
When the sodium cyanide dosage is 12kg/t and the cyanide leaching time is 66h, the cyanide leaching rate of silver can reach 87.63%.
6.6 Comprehensive condition test
Test condition: the grinding fineness of -0.074mm accounts for 90%, the pretreatment time is 4h, the calcium oxide dosage is 14kg/t, the sodium cyanide dosage is 7kg/t, the cyanide leaching time is 24h and the pulp density is 40%. See Fig.8 for the test flow and Table 14 for the test result.
Given that the sodium cyanide dosage is larger and the leaching time is longer in silver cyanide leaching than that in gold leaching, the comprehensive condition follows that in gold cyanide leaching.
Table 14 Cyanide Leaching Comprehensive Condition Test Result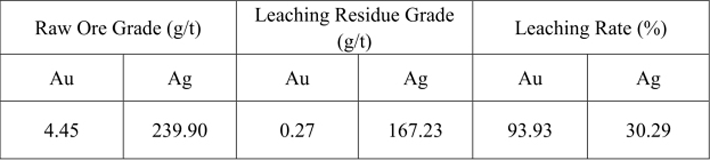
When the grinding fineness of -0.074mm accounts for 90%, the pretreatment time is 4h, the calcium oxide dosage is 14kg/t, the sodium cyanide dosage is 7kg/t and the cyanide leaching time is 24h, the cyanide leaching rate of gold can reach 93.93% while that of silver is 30.29%.
Under the cyanide condition with relatively ideal gold leaching rate, the silver cyanide leaching rate is low. It can be considered to recover the silver through flotation of the leaching residue.
6.7 Cyanidation Summary
The all-slime cyanidation test result shows that when the grinding fineness of ﹣0.074mm accounts for 90%, the pretreatment time is 4h, the calcium oxide dosage is 14kg/t, the sodium cyanide dosage is 7kg/t and the cyanide leaching time is 24h, the cyanide leaching rate of gold can reach 93.93% and the gold cyanidation index is relatively ideal.
Because the ore possesses weak acidity, the cyanided calcium oxide dosage is relatively high; in the ore, the content of Cu is 0.75%, the copper mineral is copper oxide, thus the sodium cyanide dosage is relatively high.
Under cyanide condition with relatively ideal gold leaching rate, the silver cyanide leaching rate is low. When the sodium cyanide dosage is 12kg/t and the cyanide leaching time is 66h, the silver cyanide leaching rate can reach 87.63%.
In order to achieve a relatively ideal silver cyanide leaching rate, need high sodium cyanide dosage and long leaching time will increase the production cost as well as increase the treatment cost of cyanide tailings water and the pressure of environmental protection.
7. Silver Flotation from Leaching Residue Test
Silver are recovered through flotation from the washed cyanide leaching residue. See Fig.9 for the test flow and Table 15 for the test result.
Table 15 Silver Flotation from Cyanide Tailings Test Result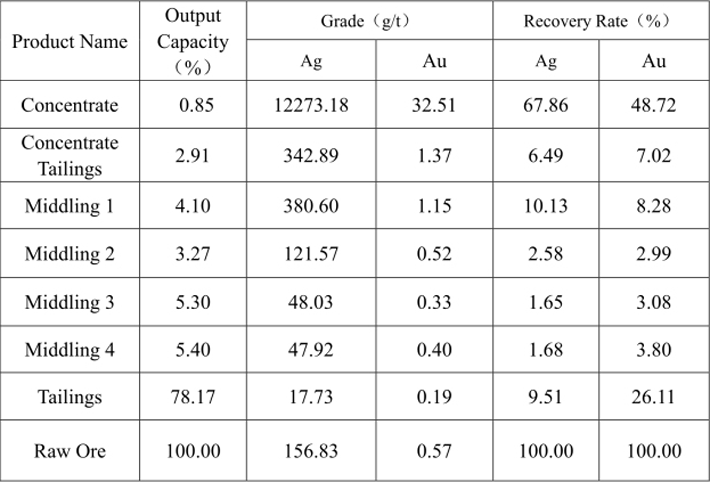
Better silver recovery indexes can be obtained through the flotation of the cyanide gold leaching tailings residue. After the primary cleaning, in the concentrate, the silver grade can reach 12273.18g/t, the silver recovery rate is 67.86% and the silver remaining rate in tailings is 9.51%.
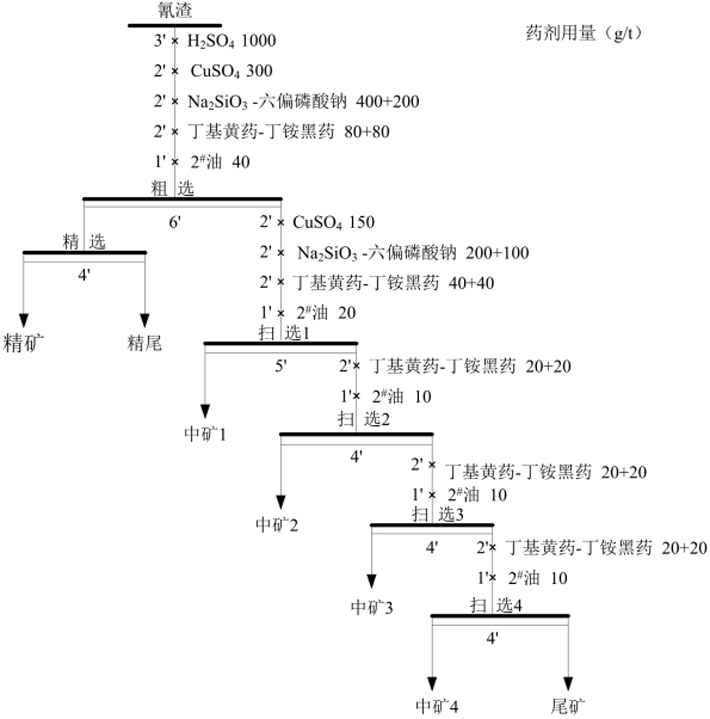 Fig.9 Silver Flotation from Cyanide Tailings Test Flow
8. Analysis of Major Elements in Pregnant Solution (see Table 16)
Table 16 Analysis Result of Major Elements in Cyanide Pregnant Solution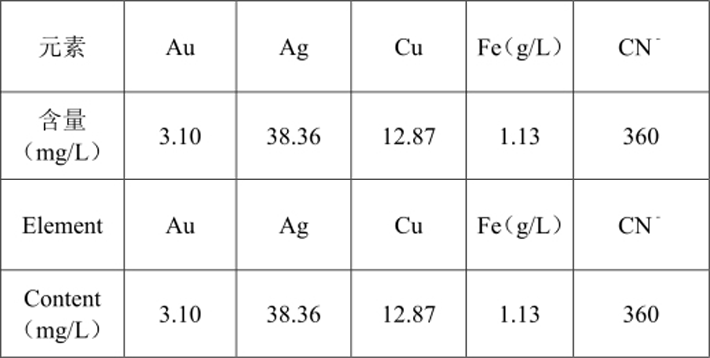
9. Settlement Test
See Table 17 and Fig.10 for the result of cyanide raw ore (﹣0.074mm90%) settlement test.
Table 17 Cyanide Raw Ore Settlement Test Result
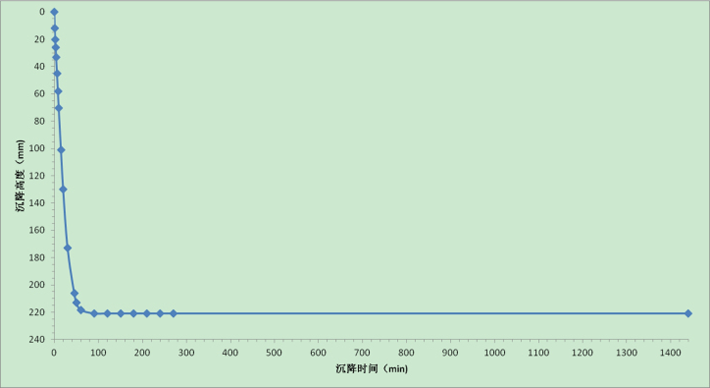 Table 10 Cyanide Raw Ore Settling Curve
10. Conclusion
(1) The mineral composition of the ore is relatively simple. The metallic minerals in the ore are mainly ferric oxide and copper oxide, the gangue minerals are mainly quartz. The chemical analysis result of the sample is as follows: gold grade is 4.45g/t, silver grade is 239.90 g/t, with content of copper as 0.73%, content of iron as 13.63% and content of quartz as 58.69%. The recyclable elements in the ore are gold and silver.
(2) Because of the high degree of oxidation of the ore, the flotation indexes are not that ideal. The result of the flotation open-circuit test is as follows: after the primary cleaning, in concentrate, the gold grade is 131.0g/t and the silver grade is 8760.74 g/t, the gold recovery rate is 63.52% and the silver recovery rate is 74.41%. After four scavengings, the remaining rates of gold and silver in tailings are 11.43% and 5.80% respectively. The flotation recovery index of silver is better than that of gold.
(3) The all-slime cyanidation test result shows that under the condition adopted by the test, the cyanide leaching rate of gold can reach 93.93% and the gold cyanidation index is relatively ideal. Because the ore possesses weak acidity, the cyanided calcium oxide dosage is relatively high; in the ore, the content of Cu is 0.75%, the copper mineral is copper oxide, thus the sodium cyanide dosage is relatively high. In order to achieve a relatively ideal silver cyanide leaching rate, need high sodium cyanide dosage and long leaching time will increase the production cost as well as increase the treatment cost of cyanide tailings water and the pressure of environmental protection.
(4) Better silver recovery indexes can be obtained through the flotation of the cyanide gold leaching tailings residue. After the primary cleaning, in the concentrate, the silver grade can reach 12273.18g/t, the silver recovery rate is 67.86% and the silver remaining rate in tailings is 9.51%.
(5) According to the test result, the ore adopts the process of all-slime cyanidation followed by Zinc replacement to recover the gold and silver; and also can adopt the process of all-slime cyanidation followed by Zinc replacement to recover the gold, silver is considered to be recycled through the flotation process on the cyanide gold leaching tailings. The client and the design department can compare the technical and economical index of the two processes, then adopt the better one.
(6) The process conditions and technical indexes proposed in this experiment are only responsible for this ore sample.